Quote: "(01:17:44) gufi: imo more fun when i have users that find problems"
So let's help make it fun for the guy! :-)
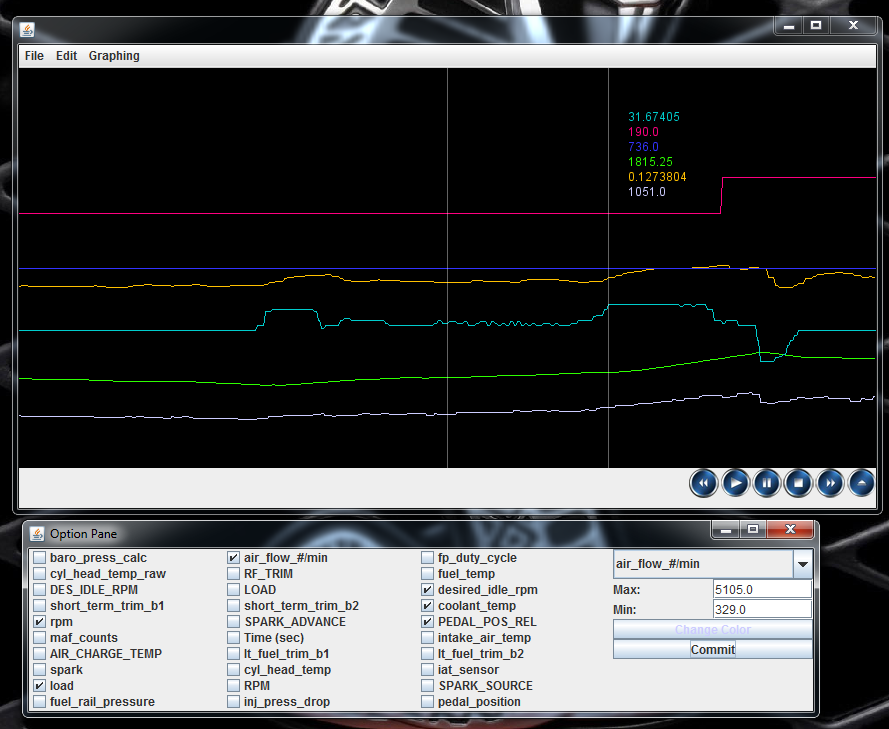
Screeny:

Source:
https://github.com/gufi/OpenLogViewer
Enjoy! :-)
Fred.

Code: Select all
sudo apt-get install ant sun-java6-jdk sun-java6-jreCode: Select all
~/Applications/OLV/target$ java -jar OpenLogViewer-0.0.1-SNAPSHOT.jar
Exception in thread "AWT-EventQueue-0" java.awt.HeadlessException
	at java.awt.GraphicsEnvironment.checkHeadless(GraphicsEnvironment.java:173)
	at java.awt.Window.<init>(Window.java:476)
	at java.awt.Frame.<init>(Frame.java:419)
	at java.awt.Frame.<init>(Frame.java:384)
	at javax.swing.JFrame.<init>(JFrame.java:174)
	at org.diyefi.openlogviewer.OpenLogViewerApp.<init>(OpenLogViewerApp.java:67)
	at org.diyefi.openlogviewer.OpenLogViewerApp$4.run(OpenLogViewerApp.java:211)
	at java.awt.event.InvocationEvent.dispatch(InvocationEvent.java:226)
	at java.awt.EventQueue.dispatchEventImpl(EventQueue.java:647)
	at java.awt.EventQueue.access$000(EventQueue.java:96)
	at java.awt.EventQueue$1.run(EventQueue.java:608)
	at java.awt.EventQueue$1.run(EventQueue.java:606)
	at java.security.AccessController.doPrivileged(Native Method)
	at java.security.AccessControlContext$1.doIntersectionPrivilege(AccessControlContext.java:105)
	at java.awt.EventQueue.dispatchEvent(EventQueue.java:617)
	at java.awt.EventDispatchThread.pumpOneEventForFilters(EventDispatchThread.java:275)
	at java.awt.EventDispatchThread.pumpEventsForFilter(EventDispatchThread.java:200)
	at java.awt.EventDispatchThread.pumpEventsForHierarchy(EventDispatchThread.java:190)
	at java.awt.EventDispatchThread.pumpEvents(EventDispatchThread.java:185)
	at java.awt.EventDispatchThread.pumpEvents(EventDispatchThread.java:177)
at java.awt.EventDispatchThread.run(EventDispatchThread.java:138)gearhead wrote:It is definitely a good start!
No, that's pretty old. He's done some new UI things that I've not even tried in the last day or so, too. If they don't work well for you, report the issues and try the commit at the top of my repo (you can point your existing git repo at mine with some config changes).My select dialog does not look quite like that, though.
Yep, good point. For developing it, and running from source, JDK is required, and sun jdk is *always* preferable.Ok, I just figured it out. For the newbies (me) on the list, you need to have a few things installed:Code: Select all
sudo apt-get install ant sun-java6-jdk sun-java6-jre
Of course!!!! The more the merrier, and the more detailed the better, too.If I am allowed to, I am going to ask for enhancements...
Can you describe this better, please?a legend for the traces,
I think you can close it and reopen from a menu. I think you can resize it too, but I could be wrong. That whole aspect needs a lot of work.selection dialog box to hide or be smaller
What do you mean?A Y axis and an X axis
You can, it's just not obvious how, and there is no user manual. Right clicking or double clicking a value allows you to change scale and colour. It might be control clicking? I forget, but it is certainly doable.Easily change trace colors
OK, I totally agree. For now, the order of the numbers in the list when you mouse over the graph (I assume that you saw that?) is that in which you added them, NOT that in which they are in the adding view. So, I recommend:gearhead wrote:legend ( some way in the graph to identify which trace is what variable )
Unless you mean percent, you'd need a set of these per value. I'd like to see min/max displayed all the time, I think the eye can do the rest, more discussion here?X and Y axis ( numbers on the vertical and horizontal axis)
Right, the time/sample number scale across the bottom would be easy and a fantastic idea, for sure. Link or screen shot of "octave" ?gearhead wrote:Well, it sounds like we are on the same page. We need general usability. I agree that a scale may not be appropriate, it is just difficult to explain to someone else "Look at the off-yellow trace and see where it goes high. That is where I slid off the road and into the ditch." Much better to call out a time value (on the x axis) and then be able to have all traces somehow labeled so that it can be 'made sense of'. but the max/min for each trace may be useful. I think about Octave and its plotting ability and would like this to be a bit more point and click. How about the ability to drag a box on a portion of the graph to zoom in on it? The resize would take the time start and stop of the window you dragged and show all traces between those time stamps as well as some sort of label for each trace. Maybe the first 5 characters of the channel name? I dunno. Just throwing out ideas.
Read above, I not only noticed, I explained why, and I told you how to change the colour and scale. The post wasn't ttthhhhhhhhaaaaaaaaattttttttt long :-pDid yo notice that my 'channel selection box' is larger and looks significantly different than yours in the graphic you posted? Why is that. I did a git clone and built it. Should I grab a fork (or knife?) of the code and get the different selection pane? It looks like there would be a good place to change the scale of the trace and the color.
WOW. Welcome aboard! :-)The reason for my interest is that MLV now waits to count to 350 before you can look at a log unless it is registered. So, I need a log viewer from time to time and this looks like it will fit the bill.