Introducing gufi's latest creation!

OpenLogViewer is a cross-platform data log viewing application originally written by Gufi and new developed and maintained by Ben and Fred. Discuss all things OLV here!
User avatar
Fred
Moderator
Posts: 15431
Joined: Tue Jan 15, 2008 2:31 pm
Location: Home sweet home!
Contact:

Introducing gufi's latest creation!

Post by Fred »

This log viewer is already usable for viewing data in a fairly nice smooth way. The more users it gets, the more testing it will get, and the more feedback gufi will get, and the better it will become, so come on, use it! :-)

Quote: "(01:17:44) gufi: imo more fun when i have users that find problems"

So let's help make it fun for the guy! :-)
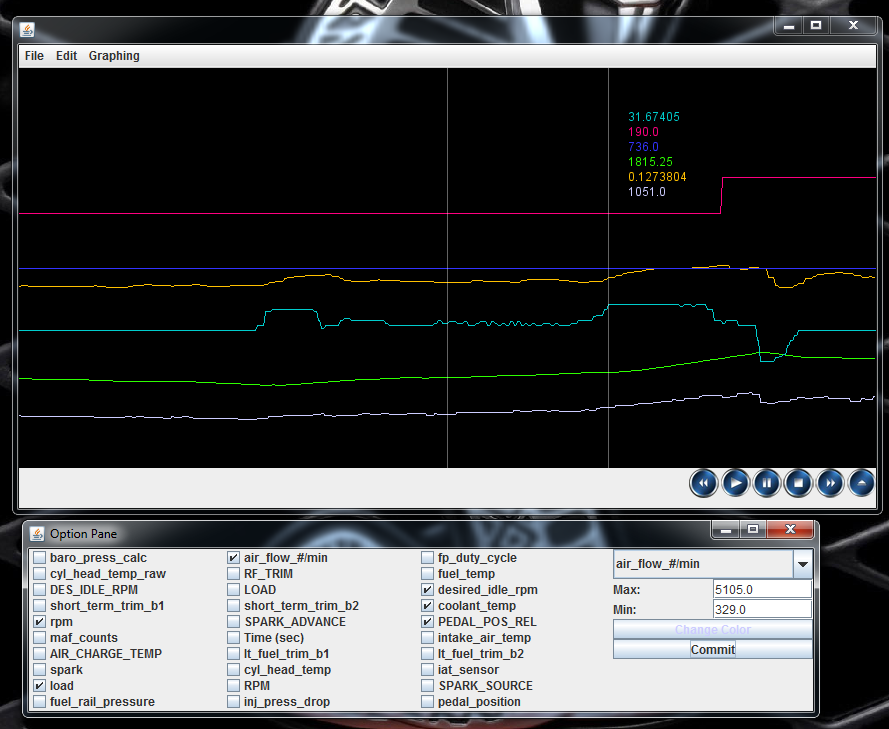
Screeny:

Image

Source:

https://github.com/gufi/OpenLogViewer

Enjoy! :-)

Fred.
DIYEFI.org - where Open Source means Open Source, and Free means Freedom
FreeEMS.org - the open source engine management system
FreeEMS dev diary and its comments thread and my turbo truck!
n00bs, do NOT PM or email tech questions! Use the forum!
The ever growing list of FreeEMS success stories!
gearhead
LQFP112 - Up with the play
Posts: 120
Joined: Sun Feb 03, 2008 9:30 pm
Location: Chicago, USA

Re: Introducing gufi's latest creation!

Post by gearhead »

It is definitely a good start! When I compile mine, I noted a couple 'issues'. 1) I can compile it using ant, but it will not run. If I load maven (apt-get install maven2) I can compile and run it. My select dialog does not look quite like that, though.

Ok, I just figured it out. For the newbies (me) on the list, you need to have a few things installed:

Code: Select all

sudo apt-get install ant sun-java6-jdk sun-java6-jre


I did not have JDK installed.

If I am allowed to, I am going to ask for enhancements...

I would like:
a legend for the traces,
selection dialog box to hide or be smaller
A Y axis and an X axis
Easily change trace colors

I am sure there is more to come, but that is my initial blush.
gearhead
LQFP112 - Up with the play
Posts: 120
Joined: Sun Feb 03, 2008 9:30 pm
Location: Chicago, USA

Re: Introducing gufi's latest creation!

Post by gearhead »

Ok, I have tried it again. My diagnosis above was on a 32 bit Ubuntu running in a VM under win7. I rebooted to native Ubuntu 11.04 x64 and am trying to get it to run here as well... It compiles just fine and I get a jar file. My error when I run it is:

Code: Select all

~/Applications/OLV/target$ java -jar OpenLogViewer-0.0.1-SNAPSHOT.jar 
Exception in thread "AWT-EventQueue-0" java.awt.HeadlessException
	at java.awt.GraphicsEnvironment.checkHeadless(GraphicsEnvironment.java:173)
	at java.awt.Window.<init>(Window.java:476)
	at java.awt.Frame.<init>(Frame.java:419)
	at java.awt.Frame.<init>(Frame.java:384)
	at javax.swing.JFrame.<init>(JFrame.java:174)
	at org.diyefi.openlogviewer.OpenLogViewerApp.<init>(OpenLogViewerApp.java:67)
	at org.diyefi.openlogviewer.OpenLogViewerApp$4.run(OpenLogViewerApp.java:211)
	at java.awt.event.InvocationEvent.dispatch(InvocationEvent.java:226)
	at java.awt.EventQueue.dispatchEventImpl(EventQueue.java:647)
	at java.awt.EventQueue.access$000(EventQueue.java:96)
	at java.awt.EventQueue$1.run(EventQueue.java:608)
	at java.awt.EventQueue$1.run(EventQueue.java:606)
	at java.security.AccessController.doPrivileged(Native Method)
	at java.security.AccessControlContext$1.doIntersectionPrivilege(AccessControlContext.java:105)
	at java.awt.EventQueue.dispatchEvent(EventQueue.java:617)
	at java.awt.EventDispatchThread.pumpOneEventForFilters(EventDispatchThread.java:275)
	at java.awt.EventDispatchThread.pumpEventsForFilter(EventDispatchThread.java:200)
	at java.awt.EventDispatchThread.pumpEventsForHierarchy(EventDispatchThread.java:190)
	at java.awt.EventDispatchThread.pumpEvents(EventDispatchThread.java:185)
	at java.awt.EventDispatchThread.pumpEvents(EventDispatchThread.java:177)
	at java.awt.EventDispatchThread.run(EventDispatchThread.java:138)
any ideas?
gearhead
LQFP112 - Up with the play
Posts: 120
Joined: Sun Feb 03, 2008 9:30 pm
Location: Chicago, USA

Re: Introducing gufi's latest creation!

Post by gearhead »

responding to my own post... It was a conflicting java jdk. I had both the sun version and open jdk installed. It now runs just fine on 64 bit as well as 32 bit.
User avatar
Fred
Moderator
Posts: 15431
Joined: Tue Jan 15, 2008 2:31 pm
Location: Home sweet home!
Contact:

Re: Introducing gufi's latest creation!

Post by Fred »

gearhead wrote:It is definitely a good start!

Absolutely! I've been using it for 3 months or so now, exclusively. MLV is banned from all of my machines and categorised as untrusted code. (like spyware/malware IMO)
My select dialog does not look quite like that, though.
No, that's pretty old. He's done some new UI things that I've not even tried in the last day or so, too. If they don't work well for you, report the issues and try the commit at the top of my repo (you can point your existing git repo at mine with some config changes).
Ok, I just figured it out. For the newbies (me) on the list, you need to have a few things installed:

Code: Select all

sudo apt-get install ant sun-java6-jdk sun-java6-jre
Yep, good point. For developing it, and running from source, JDK is required, and sun jdk is *always* preferable.
If I am allowed to, I am going to ask for enhancements...
Of course!!!! The more the merrier, and the more detailed the better, too.
a legend for the traces,
Can you describe this better, please?
selection dialog box to hide or be smaller
I think you can close it and reopen from a menu. I think you can resize it too, but I could be wrong. That whole aspect needs a lot of work.
A Y axis and an X axis
What do you mean?
Easily change trace colors
You can, it's just not obvious how, and there is no user manual. Right clicking or double clicking a value allows you to change scale and colour. It might be control clicking? I forget, but it is certainly doable.

There are performance issues too, if you use play. I just click through logs, though, so it doesn't affect me, really.

I hope that helps!

Fred.
DIYEFI.org - where Open Source means Open Source, and Free means Freedom
FreeEMS.org - the open source engine management system
FreeEMS dev diary and its comments thread and my turbo truck!
n00bs, do NOT PM or email tech questions! Use the forum!
The ever growing list of FreeEMS success stories!
User avatar
jharvey
1N4001 - Signed up
Posts: 1607
Joined: Tue Jun 10, 2008 5:17 pm

Re: Introducing gufi's latest creation!

Post by jharvey »

Perhaps a showmedo tutorial or something equivalent would help with documenting the GUI control.
gearhead
LQFP112 - Up with the play
Posts: 120
Joined: Sun Feb 03, 2008 9:30 pm
Location: Chicago, USA

Re: Introducing gufi's latest creation!

Post by gearhead »

legend ( some way in the graph to identify which trace is what variable )
X and Y axis ( numbers on the vertical and horizontal axis)

Gearhead
Attachments
OLV.png
User avatar
Fred
Moderator
Posts: 15431
Joined: Tue Jan 15, 2008 2:31 pm
Location: Home sweet home!
Contact:

Re: Introducing gufi's latest creation!

Post by Fred »

A video tutorial might be a tad of overkill at this stage, and prone to becoming VERY quickly irrelevant any time Gufi or I do work on it. Once it matures, though, it's a fine idea!

Let's add another "please": better automatic colours! This would be easy to fix, I know how it's currently done...
gearhead wrote:legend ( some way in the graph to identify which trace is what variable )
OK, I totally agree. For now, the order of the numbers in the list when you mouse over the graph (I assume that you saw that?) is that in which you added them, NOT that in which they are in the adding view. So, I recommend:

A) change colours first
B) add them sequentially such that you know the order

This is the work around I've been using... but yes, it needs to be much better.

I also suggested having numbers in one side of the other all the time, as well as, or instead of, the mouse over numbers.

BTW, given that you're probably viewing the same numbers all the time, on a real car, unlike me, you might find the "saving colours and ranges" feature useful. That needs some refinement too, like ability to only define the colour, not the range, and have profiles to load, rather than just the same set always load, etc.
X and Y axis ( numbers on the vertical and horizontal axis)
Unless you mean percent, you'd need a set of these per value. I'd like to see min/max displayed all the time, I think the eye can do the rest, more discussion here?

Now you've got me thinking about this, another thing that is missing is marks. IE, in ms logs, if you slam the space bar, you get a reference point in the log file, often indicated by a vertical line. FreeEMS may have a richer set of such marks in the form of error packets that the device sends out. Additionally, it would be great to enter marks INTO the log file from the UI with comments etc to document what you saw "at this point, i floored it, and the wheels broke loose briefly" or whatever, and save it, so when you next open it, months later, you remember what went down.

To that end, import/export functionality so you can suck in a file in X, Y or Z format and pump it out in X, Y or Z format, in any combo. Or perhaps just IN in all directions and out to some internal verbose structured format.

PS, it's great to be discussing this with another user! :-) Hooray for their being two of us! I'll try to make that number much larger soon. Sean uses it too, a little, but rarely posts, even in his own threads.

Keep the feedback and suggestions coming, anything, minor, major, whatever, if it's documented, someone can fix it, if not, it might get forgotten or get left un-noticed.

Fred.
DIYEFI.org - where Open Source means Open Source, and Free means Freedom
FreeEMS.org - the open source engine management system
FreeEMS dev diary and its comments thread and my turbo truck!
n00bs, do NOT PM or email tech questions! Use the forum!
The ever growing list of FreeEMS success stories!
gearhead
LQFP112 - Up with the play
Posts: 120
Joined: Sun Feb 03, 2008 9:30 pm
Location: Chicago, USA

Re: Introducing gufi's latest creation!

Post by gearhead »

Well, it sounds like we are on the same page. We need general usability. I agree that a scale may not be appropriate, it is just difficult to explain to someone else "Look at the off-yellow trace and see where it goes high. That is where I slid off the road and into the ditch." Much better to call out a time value (on the x axis) and then be able to have all traces somehow labeled so that it can be 'made sense of'. but the max/min for each trace may be useful. I think about Octave and its plotting ability and would like this to be a bit more point and click. How about the ability to drag a box on a portion of the graph to zoom in on it? The resize would take the time start and stop of the window you dragged and show all traces between those time stamps as well as some sort of label for each trace. Maybe the first 5 characters of the channel name? I dunno. Just throwing out ideas.

Did yo notice that my 'channel selection box' is larger and looks significantly different than yours in the graphic you posted? Why is that. I did a git clone and built it. Should I grab a fork (or knife?) of the code and get the different selection pane? It looks like there would be a good place to change the scale of the trace and the color.

The reason for my interest is that MLV now waits to count to 350 before you can look at a log unless it is registered. So, I need a log viewer from time to time and this looks like it will fit the bill.

Gearhead
User avatar
Fred
Moderator
Posts: 15431
Joined: Tue Jan 15, 2008 2:31 pm
Location: Home sweet home!
Contact:

Re: Introducing gufi's latest creation!

Post by Fred »

I just remembered that for FreeEMS binary logging use, we need a dynamic way of constructing the log data as the logs are easily source code customisable now and the scaling and so on is always wrong if the contents of the log don't match the conventions used to process it.
gearhead wrote:Well, it sounds like we are on the same page. We need general usability. I agree that a scale may not be appropriate, it is just difficult to explain to someone else "Look at the off-yellow trace and see where it goes high. That is where I slid off the road and into the ditch." Much better to call out a time value (on the x axis) and then be able to have all traces somehow labeled so that it can be 'made sense of'. but the max/min for each trace may be useful. I think about Octave and its plotting ability and would like this to be a bit more point and click. How about the ability to drag a box on a portion of the graph to zoom in on it? The resize would take the time start and stop of the window you dragged and show all traces between those time stamps as well as some sort of label for each trace. Maybe the first 5 characters of the channel name? I dunno. Just throwing out ideas.
Right, the time/sample number scale across the bottom would be easy and a fantastic idea, for sure. Link or screen shot of "octave" ?

The select for zoom idea is a good one, esp if it loaded into a new window that popped up! Which reminds me, we need the ability to zoom out as well as in, for real, on-car, logs of significant length, this is essential. The app I mention in the next paragraph does zooming very well, all horizontal, though, but that makes sense for its purpose.

For some further ideas, fire up the Saleae Logic program and play with it. It's a bit different being a binary logic analyser, but the way it works is mostly very nice. Available for win/lin/mac. If you need some real life files for it, I have plenty.
Did yo notice that my 'channel selection box' is larger and looks significantly different than yours in the graphic you posted? Why is that. I did a git clone and built it. Should I grab a fork (or knife?) of the code and get the different selection pane? It looks like there would be a good place to change the scale of the trace and the color.
Read above, I not only noticed, I explained why, and I told you how to change the colour and scale. The post wasn't ttthhhhhhhhaaaaaaaaattttttttt long :-p
The reason for my interest is that MLV now waits to count to 350 before you can look at a log unless it is registered. So, I need a log viewer from time to time and this looks like it will fit the bill.
WOW. Welcome aboard! :-)

Fred.
DIYEFI.org - where Open Source means Open Source, and Free means Freedom
FreeEMS.org - the open source engine management system
FreeEMS dev diary and its comments thread and my turbo truck!
n00bs, do NOT PM or email tech questions! Use the forum!
The ever growing list of FreeEMS success stories!
Post Reply